Evolutionary Phylogenetic Cladograms and Trees Activity, 2017
Introduction
Phylogenetics is a way to represent the evolutionary relationships within a group of organisms. There are two main pattern types or maps: Cladograms and Trees
Is a whale more closely related to a human or a shark? Even though whales and sharks both share certain features of overall body form, by following phylogenetic methods of observation and comparison we can conclude that whales and humans actually have many more detailed features in common than do whales and sharks. This can be explained by the fact that whales share a more recent common ancestry with humans than they do with sharks. We predict that their closer relationship means that they share more features in common, and the evidence supports this prediction. Similarities between whales and sharks are largely superficial and result from their common aquatic habitat, not from their descent from a common ancestor.
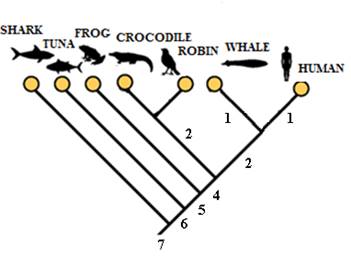
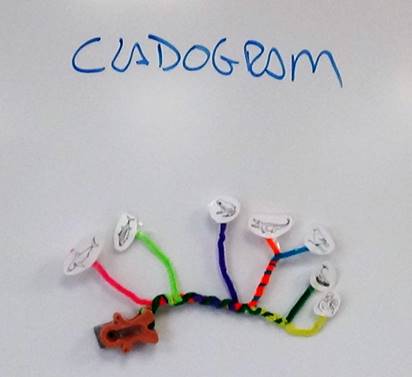
Phylogenetic Cladograms are branching diagrams that illustrate patterns of phylogenetic relationships. The pattern of branching itself is the focus of a cladogram; the relative lengths of branches in cladograms have no special significance. Time is included in cladograms only in a relative sense. For example, notice that sharks originated before whales, but cannot tell from the cladogram how long before (see Figure 1). Cladograms are reconstructed by comparing the distribution of characters among species. Characters are inherited attributes of organisms; they may be morphological, genetic, developmental, behavioral, physiological, biochemical, and so forth. Hair color, leg length, or gene sequence, for example, are characters of organisms that vary (see Figure 1).
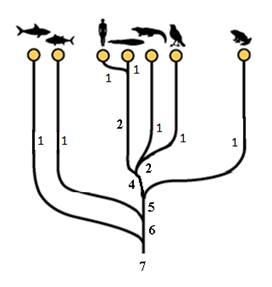
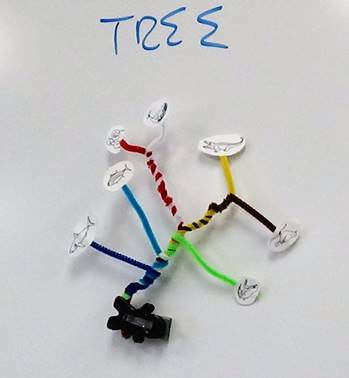
Phylogenetic Tree is a branching diagram that illustrates both branching patterns and time; branch lengths have meaning in the sense that longer branches imply longer periods of time (see Figure 2).
|
|
|
|
|
|
|
|
|
|
|
|
|
|
|
|
|
|
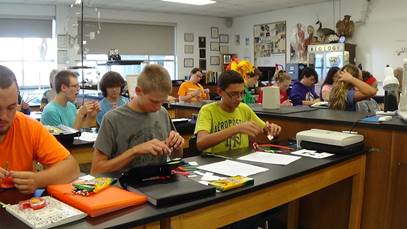
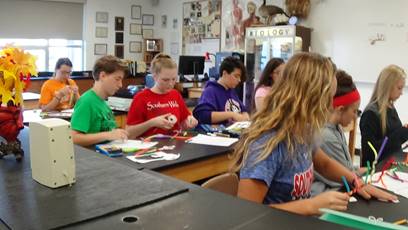
Procedure
Materials (per student)
|
(7) Different Colors of Pipe Cleaners Picture Diagrams |
Colored Pencils Tape |
Scissors Envelope (optional) |
Steps
1. Using colored pencils, color each of the animal pictures neatly and then using scissors cut around each animal picture; a circle around the picture is just fine.
2. Decide which type of “phylogenetic illustration” you wish to construct, a Cladogram or a Tree version. You will use the phylogenetic picture you chosen as a guide in making your model.
3. Hold all the pipe cleaners equally distant from each other in a bundle. Again, use the phylogenetic illustration that you chose on the front page as a guide.
4. Tightly twist all the pipe cleaners at the bottom of your bundle to represent the “common ancestor” that all animals depicted will have.
5. As you move up your bundle, twist the pipe cleaners; however, when you come to a “fork in the road” or “branch” do not include a pipe cleaner. That pipe cleaner will then represent a species “branching” off. Note: Numbers on diagrams represent number of pipe cleaners that are twisted at that point on the model.
6. Once your model showing divergences of species is completed with the pipe cleaners, use tape to attach the animals accordingly at the tips of your phylogenetic map.
Result Questions
Answer the following “or” questions in accordance to your model, background and evolution: 2 points each
1. Would you agree that all the organisms share one common ancestor and that they are all related (yes or no)?
2. Does the crocodile have more in common with the “robin”, “tuna”, or “frog”?
3. Would you agree that “sharks” or “tuna” have been around the longest?
4. Are humans more closely related to the “frog”, “whale”, or “robin”?
5. Would a “closer” or “more distant” relationship mean that organisms share more common features?
6. According to your model, did the organisms appear “all at once” or “gradually” based on their ancestors?
Table: When creating a phylogenetic model, branches depict differences in characteristics. Place an “X” in the squares that indicate that the following species “mostly” have the characteristic listed: 1 pt / box
Research (Text / Internet) Each (Note: A Couple May be Tricky)
|
|
Hair |
Feathers |
Lungs |
Bipedal |
Ectotherm |
Symmetry |
|
Human |
|
|
|
|
|
|
|
Whale |
(tricky) |
|
|
|
|
|
|
Crocodile |
|
|
|
|
|
|
|
Robin |
|
|
|
|
|
|
|
Tuna |
|
|
|
|
(tricky) |
|
|
Frog |
|
|
|
|
|
|
|
Shark |
|
|
|
|
(most) |
|
Bipedal = walk on two limbs (legs)
Ectotherm = are unable to regulate their own body temperature; “cold-blooded”
Bi-Lateral Symmetry = only one plane, sagittal plane, will divide an organism into roughly mirror image halves
Extra: Visit the Following Sites: http://www.onezoom.org
http://www.amnh.org/ology/features/treeoflife/pages/cladogram.php
Evolutionary Phylogenetic Cladograms and Trees Activity Diagrams
|
|
|
|
|
|
|
|
|
|
|
|