Making
Cents of Radiometric Decay
Introduction
What is radiometric decay? Evolution is the unifying principle in biology, as
it provides an explanation for the overwhelming diversity of forms and function
seen in life on Earth. The distribution, morphology, and genetics of
living populations all provide evidence for evolution, but the complete picture
cannot be understood by the study of living population alone. The origin
of major new structures and body plans can be studied through the archive of
evolution, the fossil record. Fossils, traces of once living organisms, are
found most commonly in layers of sedimentary rock. This rock type forms
when water and wind form layers of sand and silt. Over time, the sedimentary
layers become rock. The order in which fossils are
buried and the findings of transitional fossils (changes seen from one species
to another) are two major lines of fossil evidence for evolution.
A variety of methods can be used to determine the age of fossils. “Relative
dating” is determined by comparing fossil and rock position in relation to
other fossils or rocks. “Absolute dating” can give actual dates of fossils. The
most common type of absolute dating is called, “radiometric dating”. Any
radioactive substance can be used for dating, but it is important to select a
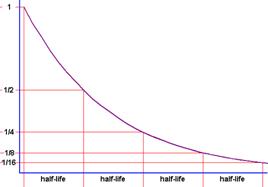
radioactive material with a “rate of decay” or “half-life” that fits the time
range for the fossil being studied. When radioactive atoms decay, they release
electrons, protons, and neutrons at a constant rate. The length of time
it takes half of the radioactive atoms in a sample to decay is called a
“half-life”. You cannot predict with individual atoms will decay because
the process is random and spontaneous, but you can predict how
many will decay if you know the half-life. Examples of radioactive
materials and their half-lives include: Potassium 40 à Argon 40 = 1.3 billion years;
Uranium 235 à Lead
207 = 713 million years; Carbon 14 à Nitrogen 14 = 5,740 years. If one were to
model radiometric decay, then the understanding of half-life will become
evident.
Method
Materials: Per Group
|
Plastic Box with Lid 100 Pennies (in Zip-lock bag) 100 Paper Clips (in Zip-lock bag) Calculator |
Pencil / Pen Graphing Software (optional) Resources |
Procedure:
1.
Make sure you have
100 pennies by counting them out and placing them “Heads” up in your
box; do not worry about the paper clips at this time. If you need more pennies
let the instructor know.
2.
For this activity,
pennies will represent radioactive isotopes (atoms). “Heads” will represent
unchanged atoms, while “Tails” will represent decayed atoms that change into
“Paper Clips” since radioactive isotopes do not just disappear but literally
change into a different isotope.
3.
Perform the first
trial by closing the lid, placing your hand/fingers on the lid, and shaking the
container for 30 seconds.
4.
Count and remove
the number of “Changed Atoms” (or Tails), place them back into the bag, and replace them with paper clips in the box.
5.
Record the number
of “Changed Atoms” (or Tails) in the table provided.
6.
Count but do not
remove the number of “Unchanged Atoms” (or Heads).
7.
Record the number
of “Unchanged Atoms” (or Heads) in the table provided.
8.
Calculate the
“Percent of Atoms Changed” per trial by using a calculator. Record the
percentage of “Atoms Changed” in the table provided:
9.
Repeat steps 3-8
until you have 100% of “Changed Atoms”.
10.
Clean and return
all materials as directed and complete the Graphing Exercise and the Result
Data Sheet questions.
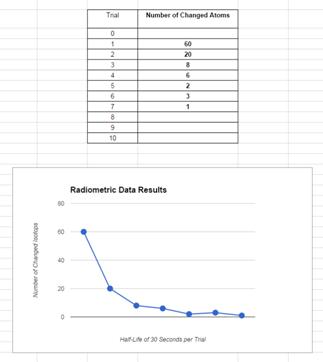
Graphing Exercise: 10 Points [Work in partners to
complete (one with the lab directions, one with the spread sheet (ie Google Sheets) open)] See Directions Below
Create a column using only the “Number of
Changed Atoms” data from your table.
Highlight the numbers (do not include 0) and then
select the graphing icon (top right side).
Select
“Charts” and then “Line Graph” for this lab and click “insert”.
By
using the “advanced tab” on the graph (upper right arrow down) label the
following: Title: Radiometric Data Results ; Let X “horizontal” axis: Number
of Trials ; Let Y “vertical” axis: Number of Changed Isotopes (Under
“Axis” select down arrow for Vertical Title); Under Series: Point Size = 10px
Result Date Sheet for Radiometric
Decay Activity
Table:
|
Trials |
Number of Changed Atoms (Tails
Changed Paper Clips) |
Number of Unchanged Atoms (Heads
Left) |
Percent of Atoms Changed (Changed # / Last Unchanged #)
x 100 |
|
|
0 |
100 |
0% |
|
1 |
|
|
|
|
2 |
|
|
|
|
3 |
|
|
|
|
4 |
|
|
|
|
5 |
|
|
|
|
6 |
|
|
|
|
7 |
|
|
|
|
8 |
|
|
|
|
9 |
|
|
|
|
10 |
|
|
|
Questions:
1.
What is the
half-life of these “atoms”? In other words, how long (time) did it take for
about half the pennies (atoms/isotopes) to change into paper clips (changed
atoms/isotopes)?
2.
Isotopes do not
truly decay and go away but can “change” into different atoms. (Yes or No)
3.
If each trial
represented a half-life value of 1,500 years, how old would a fictional fossil
be by the 3rd trial?
4.
If the half-life
rate of Carbon 14 is 5,740 years, how many half-lives would a fossil plant have
gone through if the fossil was dated to be 22,960 years old and thus be made up
of about 94% of Nitrogen 14 and about 6% or 1/16th of Carbon 14
left?
5.
Was the hypothesis
proven or disproven for this activity? (Start by saying, The
hypothesis was ….)
6.
According to
the background information, what is “absolute dating”?
7.
Does radioactive
decay help to determine the age of fossils? (Yes or No)
8.
What defines
“half-life” according to the background information?
9.
Fossils can be
mostly found in what type of rock according to the background information?
10.
What would be an
improvement to this lab activity? (Start by saying, An
improvement to this lab activity would be ….)